Key takeaways
- A report built by hand costs the hours to build it every time, plus the decisions made on numbers that are already old.
- List every report you rely on, who builds it, which apps it pulls from and how long it takes.
- In a 2023 Microsoft survey, 62 percent of people said they spend too much time searching for information at work.
- The aim is not a prettier dashboard. It is getting an answer when you ask the question.
The cost of manual reporting hides inside a simple question: how are we doing? To answer it, someone exports sales from one app and invoices from another. They paste both into a spreadsheet, fix the dates that came out in the wrong format, check that the totals look right and email it round. By the time you read it, the numbers describe last week.
Nobody thinks of this as a cost. It’s just how the report gets made. But it happens every week, it takes real hours, and it shapes which questions you ask. This post helps you count all three.
List every report you rely on
Start with an honest list. Include the formal ones, like the weekly sales summary, and the informal ones, like the text you send your bookkeeper asking what came in yesterday.
Here’s a sample of how the list can look. The reports and hours are invented, so you can see the shape.
| Report | Who builds it | Apps it pulls from | Hours each time | How often |
|---|---|---|---|---|
| Weekly sales | Office manager | Point of sale, invoicing | 2 | Weekly |
| Cash position | Bookkeeper | Bank, invoicing, payroll | 4 | Monthly |
| Open jobs | Owner | Scheduling, email, spreadsheet | 1.5 | Weekly |
| Late payers | Bookkeeper | Invoicing | 1 | Every two weeks |
Add a last column if you can: who actually reads it, and what they decide because of it. A report nobody acts on is a cost with no return.
Where the hours go
A lot of the time in a manual report isn’t analysis. It’s fetching. Someone signs in to each app, finds the right screen, sets the dates, exports, waits, opens the file and tidies it up. Then they do the same for the next app.
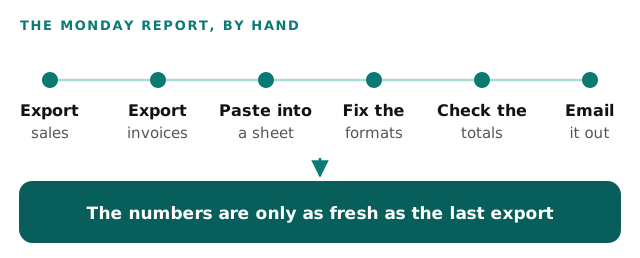
That kind of fetching is familiar to a lot of people. In Microsoft’s 2023 Work Trend Index survey, 62 percent of people said they struggle with too much time spent searching for information in their workday (Microsoft). A weekly report is the same search, run on a schedule.
There’s also the checking. A report pasted together from exports is a spreadsheet, with all the risks spreadsheets carry. A formula that misses a row will still give you a total. We wrote about that in the hidden cost of spreadsheets.
Price the hours
Turn the list into one number a week. Convert monthly and fortnightly reports to weekly hours, then add them up. In the sample above, that’s 2 hours for weekly sales, about 1 hour for the cash position (4 hours a month), 1.5 hours for open jobs and half an hour for late payers. That comes to about 5 hours a week.
Then multiply by what an hour of staff time costs you and by 50 working weeks. The best hourly figure is your own payroll cost divided by hours worked. If you only know the wage, remember that it’s not the whole cost. In June 2026, private employers paid an average of $46.89 per hour worked, of which $32.82 was wages (BLS).
| Line | Example | Yours |
|---|---|---|
| Report hours a week, all reports | 5 | |
| Cost of a staff hour | $35 | |
| Reporting time per year (5 × $35 × 50) | $8,750 |
Notice who built those reports in the sample. One of them is the owner. If your own time goes into reports, price it at what your time is worth to the business, not at an office wage. For an owner, that can change the answer a lot.
The questions nobody asks
Hours are only half of it. The bigger cost of manual reporting is the questions that never get asked, because getting the answer takes too long.
Think about the last time you wondered something specific. Which customers haven’t ordered in three months? How much is owed to us that’s more than 60 days late? Which jobs went over their quote? If answering means someone stopping their work for an hour, you probably didn’t ask. You made the call on instinct instead.
Instinct is often right. But a business run on last week’s numbers and instinct finds problems late. The slow-paying customer is noticed when cash gets tight. The job type that loses money is noticed at year end. Each late discovery has a cost of its own.
You can’t put an exact figure on a question you didn’t ask. You can list three questions you’d have asked this month if the answer were instant. That list is a fair guide to what slow reporting is costing you.
Pick the first report to fix
You don’t need to fix every report at once. Use the list you made to pick one.
- Circle the report that takes the most hours across a month.
- Count the apps it pulls from. Each extra app is another sign-in, export and cleanup.
- Write down the decision it feeds, and how fresh the numbers need to be for that decision.
- Ask the person who builds it which step they would happily never do again.
That last question is worth asking out loud. The person who builds a report knows exactly which step is pointless, and they may never have been asked. Their answer is often the cheapest place to start.
Why another dashboard tool often disappoints
When reporting gets painful, the usual suggestion is a business intelligence or dashboard tool. These can be excellent. They can also become one more thing to maintain.
They need clean, connected data first. A dashboard is only as good as what feeds it. If your data still lives in exports and spreadsheets, someone has to build and keep up the pipes before the first chart appears.
Someone has to own the reports. Dashboards don’t design themselves. Each chart is a decision about what to measure and how. Without an owner, the dashboard drifts out of date and people go back to the spreadsheet.
They answer the questions you set up in advance. A dashboard shows what someone decided to show. The unexpected question, the one that comes up on a Tuesday afternoon, still means an export.
It’s another login and another bill. That’s a small point, but it’s real, and it adds up with every tool.
What to look for instead
The goal isn’t more charts. It’s getting a trustworthy answer when you ask the question.
| Ask for | Instead of |
|---|---|
| Numbers pulled straight from the apps you already use | Exports pasted into a spreadsheet |
| A way to ask a new question in plain words | Waiting for someone to build a new report |
| Answers that show where each number came from | Totals you have to take on trust |
| A short list of numbers you check every week | A wall of charts nobody opens |
| A trial on your real data before anything changes | Switching over before you’ve seen it work |
If the dashboard route is right for you, our page on an AI KPI dashboard for small business covers what that involves.
A dashboard you can ask
We built an AI assistant and operations dashboard that works this way. It connects to the apps a business uses and answers questions about sales, orders and cash in plain words. It also drafts email replies for a person to approve. It’s a working demo, shown on sample data.
The screen matters less than what sits behind it: how the apps are connected and how each answer is put together from them. That’s the part worth seeing up close.
Behind the scenes
Want a behind-the-scenes walkthrough of a real build?
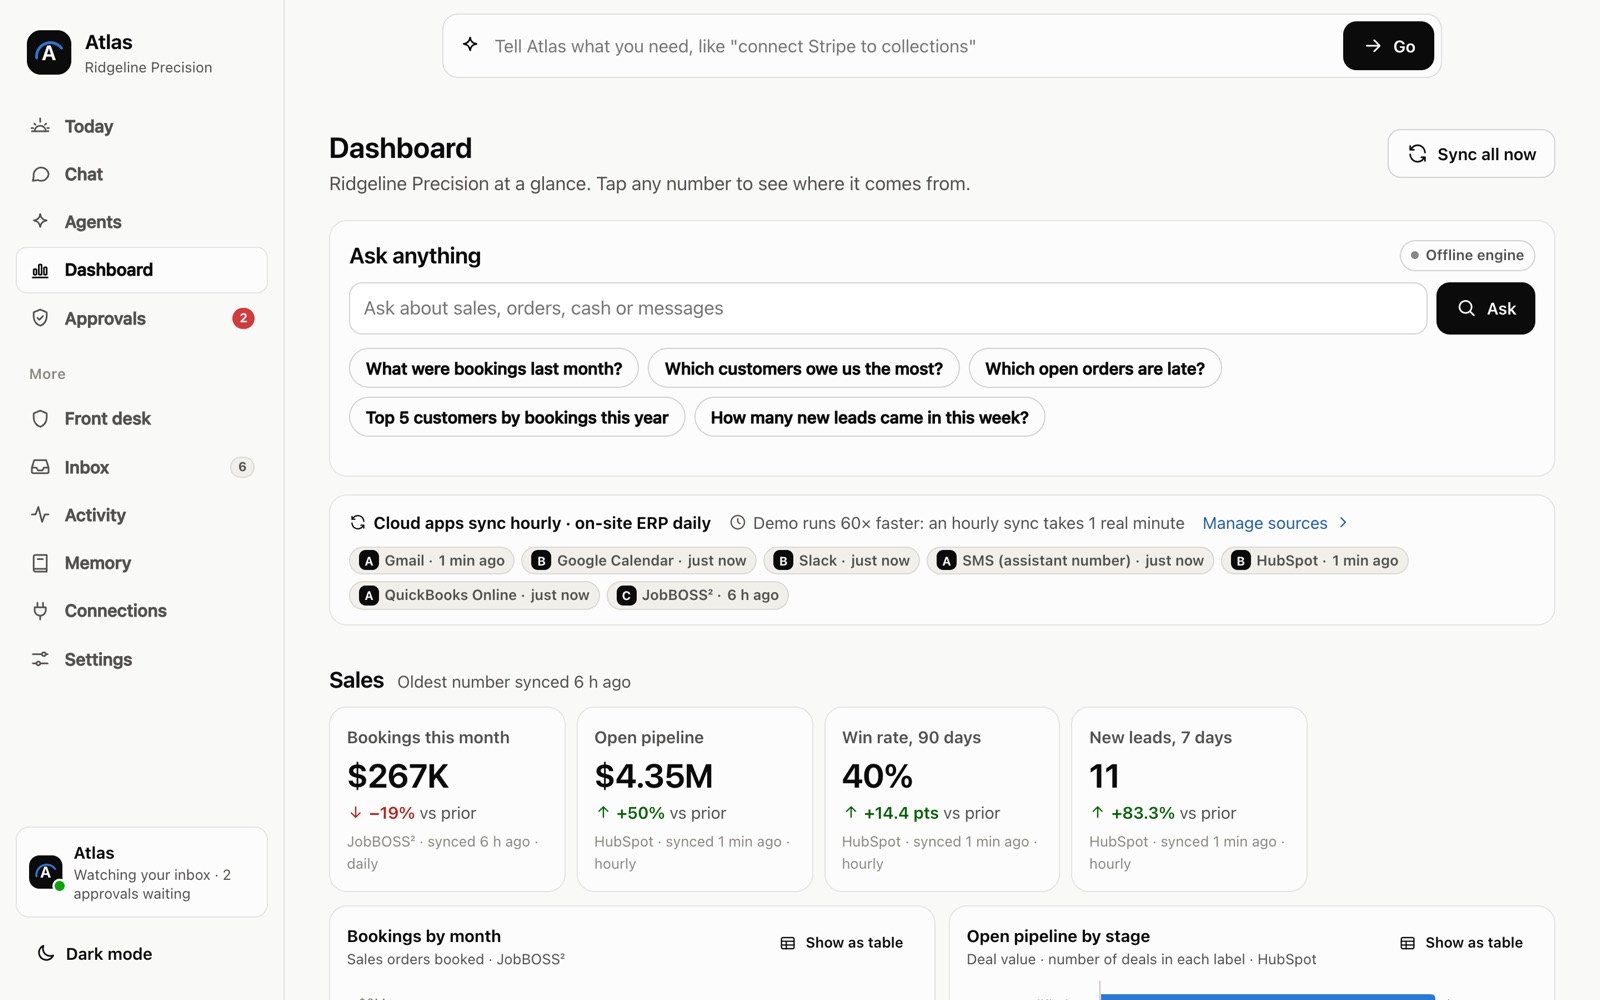
We will take you through it screen by screen: what each person sees, how a record moves through it, and why we built it that way. Then we can talk about the task that costs you most.
Frequently asked questions
Which reports should a small business automate first?
The one that takes the most hours, runs most often and pulls from the most apps. A weekly report built from three exports is a better first target than a yearly one built from one.
Do we need a business intelligence tool to stop building reports by hand?
Not necessarily. Those tools work well when your data is already clean and someone owns the reports. For many small teams, connecting the apps and getting answers to a short list of questions comes first.
How fresh do our numbers need to be?
As fresh as the decision they feed. Cash and stock decisions often need today's numbers. A monthly trend can wait for the month to close. Match each report to the decision, not the other way round.
Sources
About the author
Andy Kang, AI Partner Team. Andy Kang writes the blog for AI Partner Team, which builds AI tools and internal apps for small businesses alongside managed IT and IT projects. The blog shows the math and the reasoning behind that work, so you can check it against your own business.
- Every fact links to the page it came from, listed under Sources.
- Example numbers are labelled as examples, and you can swap in your own.
- Builds are shown on sample data, with no client names or client figures.